 Skip to content
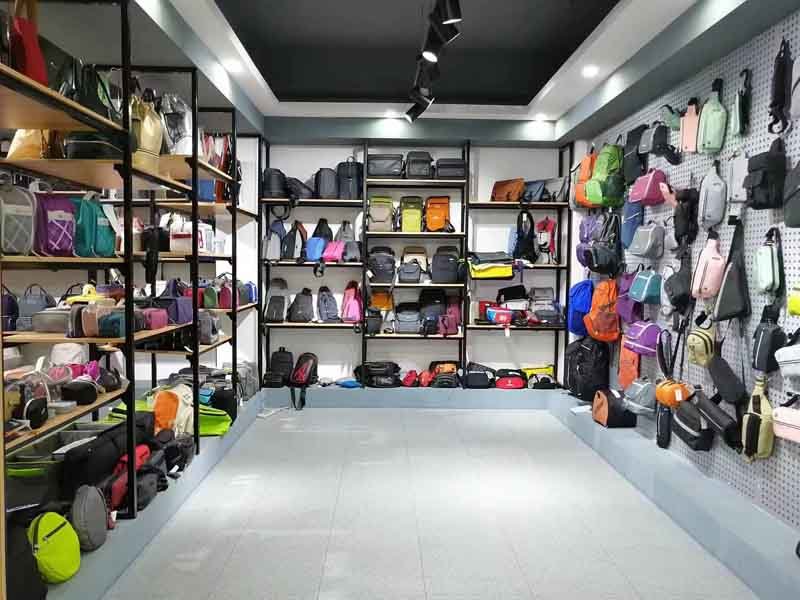
Diving into the bag manufacturing industry today feels like standing at a bustling crossroads. On one side, the explosion of e-commerce and direct-to-consumer brands has created insatiable demand for everything from chic tote bags to high-tech dry bags. On the other, rising raw material costs, labor considerations, and global supply-chain challenges threaten margins. Yet, for those who master cost control, design differentiation, and smart sales channels, bag production remains a remarkably lucrative venture. Making bags can be highly profitable when you optimize cost drivers—materials, labor, tooling, and overhead—and focus on high-margin styles like specialty dry bags and premium backpacks. Startup costs range from \$20,000–\$100,000 depending on tooling and facility scale. Custom OEM/ODM orders with low MOQs further boost margins by cutting inventory risks. Success hinges on selecting the right materials, understanding per-unit costs, and leveraging e-commerce and B2B channels effectively.
Imagine Sarah, a small-batch designer who invested \$25,000 to launch her private-label tote line. By partnering with a reliable factory offering low-MOQ prototyping, she turned her initial investment profitable within six months—despite a global leather price spike. Ready to uncover how you can replicate her success?
What Are the Main Cost Drivers in Bag Manufacturing?
The primary cost drivers in bag manufacturing are raw materials (leather, fabrics, hardware), labor (cutting, stitching, finishing), tooling and sample development, and factory overhead (rent, utilities, quality control). Raw materials can consume 40–60% of total unit cost, while labor adds another 20–30%. Tooling amortization and overhead each account for roughly 10–15%. Increasing production volumes unlock economies of scale, reducing per-unit material waste by up to 10% and labor time by 15%.
When assessing the profitability of bag production, understanding where your dollars are spent is essential. Let’s break down the four core cost drivers, explore how they interact, and examine strategies to optimize each category.
1. Raw Materials (40–60% of Unit Cost)
Materials are the single largest expense. Depending on your bag type, this includes:
| Material Component | Cost per Unit (USD) | % of Total Cost |
|---|---|---|
| Full-Grain Leather | \$10–\$30 | 20–35% |
| Technical Fabrics | \$5–\$15 | 10–20% |
| Hardware | \$2–\$8 | 5–10% |
| Thread & Notions | \$0.50–\$2 | 2–5% |
- Leather Variance: Premium hides from Italy or Argentina cost more but add resale value. Budget leather or synthetic alternatives reduce upfront spend but may hurt brand perception and longevity.
- Fabric Choices: Neoprene and TPU laminates command higher per-meter prices yet justify premium pricing for specialty bags. Bulk ordering can lower fabric costs by 10–15%.
- Hardware Sourcing: Buying solid-brass buckles and YKK zippers in large volumes can yield 20–30% discounts. Skimping on hardware quality often leads to customer complaints and returns.
2. Labor Costs (20–30% of Unit Cost)
Labor encompasses the hands-on work: cutting, skiving, sewing, assembly, and finishing.
Regional Wage Differences: A stitching operator in inland China might cost \$5/hour, whereas in coastal regions or Eastern Europe, rates climb to \$8–\$12/hour.
Process Time Estimates:
- Cutting & Skiving: 15 minutes/unit
- Stitching & Assembly: 30–45 minutes/unit
- Finishing & QC: 10–15 minutes/unit
At \$6/hour, stitching adds roughly \$3–\$4.50 per bag. Training and lean workflows (e.g., Kaizen techniques) can shave 10–15% off these times.
Skill Level Premiums: Complex designs requiring hand-saddle stitching or tooling incur higher labor rates but deliver a luxury finish that supports higher price points.
3. Tooling & Sample Development (10–15% of Unit Cost)
Tooling includes dies for cutting, mold fixtures, and stitching jigs.
- Initial Investment: \$2,000–\$10,000 depending on bag complexity.
- Sample Costs: \$200–\$500 per prototype.
Tooling costs are typically amortized over production volume:
| Volume Tier | Tooling Cost/Unit |
|---|---|
| <500 units | \$10–\$20 |
| 500–2,000 units | \$4–\$8 |
| >5,000 units | \$1–\$3 |
Focusing on a limited SKU range in early production helps spread tooling costs more efficiently, while digital patterning and CNC cutting can further reduce waste.
4. Factory Overhead (10–15% of Unit Cost)
Overhead encapsulates fixed expenses:
| Overhead Category | Annual Cost (USD) | Cost/Unit at 10,000 Units |
|---|---|---|
| Facility Rent | \$100,000 | \$10 |
| Utilities & Maintenance | \$20,000 | \$2 |
| Equipment Depreciation | \$30,000 | \$3 |
| Admin & QC Staff | \$80,000 | \$8 |
Optimizing overhead involves:
- Location Strategy: Factories in second-tier cities often offer 15–20% lower rent and labor, though logistics must be weighed.
- Lean Layouts: Implementing 5S and just-in-time inventory practices reduces idle time and storage costs.
- Shared Services: Co-working atelier spaces or shared warehouses can cut overhead for smaller brands.
Tip: Factories in inland China or Vietnam offer 15–20% lower overhead than coastal tier-1 cities, though logistics costs may increase.
5. Economies of Scale & Critical Trade-Offs
- Volume Effect: Doubling output typically reduces material waste by \~10% and labor per-unit time by 15%, shrinking overall COGS.
- Quality vs. Cost: While premium materials and skilled labor drive up cost, they enable premium pricing and strengthen brand reputation. Conversely, aggressive cost-cutting risks increased returns and brand damage.
- Vertical Integration: Owning part of your supply chain—like an in-house tannery or injection mold shop—can lower material and tooling costs by 10–15% but demands higher capital and management expertise.
Startup Cost: How Much to Begin?
Launching a bag company typically requires:
- Equipment & Tooling: \$15,000–\$50,000
- Sample Development & Design: \$5,000–\$15,000
- Initial Inventory: \$10,000–\$30,000
- Marketing & E-commerce Setup: \$5,000–\$15,000
Total Estimate: \$20,000–\$100,000. Those on tight budgets often start with a limited SKU range and expand as revenues grow.
Which Bag Styles Yield the Highest Profit Margins?
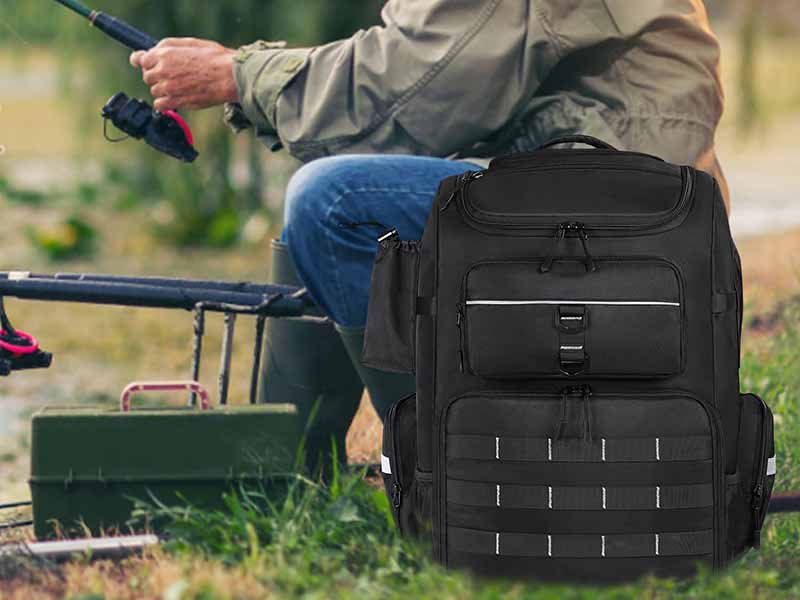
Specialty and premium bags typically deliver the best margins: technical dry bags, neoprene backpacks, and fireproof or smell-proof bags can yield 60–70% gross margins, thanks to their functional differentiation and perceived value. Mid-range styles—like travel backpacks and leather handbags—often see 45–60% margins, while basic drawstring or tote bags usually hover at 30–50%. By focusing on high-value features and niche markets, manufacturers can command premium pricing and protect profitability.
Not every bag is created equal when it comes to profitability. The key to maximizing margins lies in identifying styles that combine relatively low incremental production costs with strong consumer willingness to pay. Below, we explore the top-performing categories, analyze what drives their pricing power, and offer strategic takeaways for bag makers and brands.
1. Technical & Functional Bags: The Margin Leaders
| Bag Style | Typical COGS\* | Retail Price | Gross Margin | Core Value Proposition |
|---|---|---|---|---|
| Dry Bags (TPU/Tarpaulin) | \$8–\$12 | \$30–\$50 | 66–76% | Waterproof sealing for outdoor enthusiasts |
| Neoprene Backpacks | \$8–\$15 | \$35–\$60 | 57–73% | Insulation, impact protection, premium feel |
| Fireproof/Smell-Proof Bags | \$12–\$20 | \$45–\$80 | 55–75% | Specialized liners for documents, tools, or perishable items |
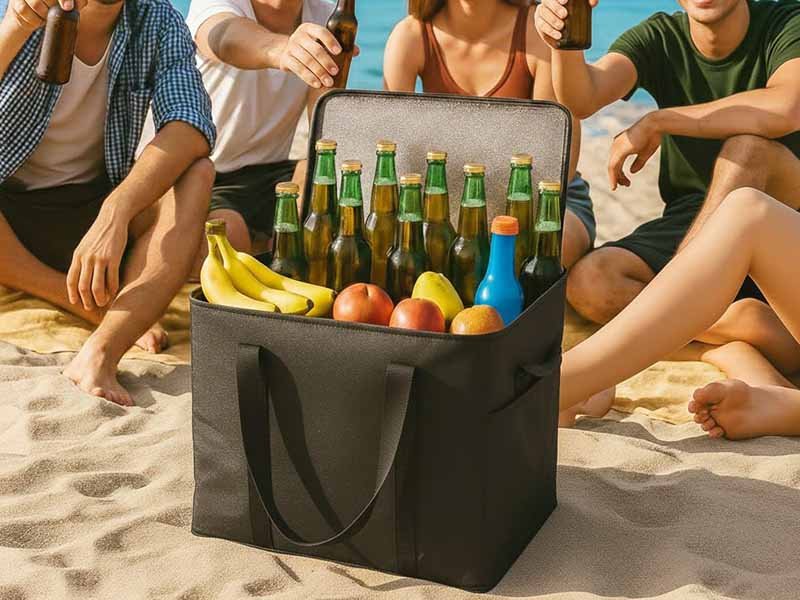
| Cold/Insulated Cooler Bags | \$7–\$12 | \$25–\$45 | 64–73% | Temperature control for food and beverages |
\*COGS = Cost of Goods Sold
Why They Work:
- Niche Necessity: Consumers pay up to 3× more for bags that solve specific problems—keeping gear dry, food cool, or odors contained.
- Material Premium: Technical fabrics and specialized linings cost more, but these costs are offset by premium retail prices.
- Low Price Sensitivity: Buyers in outdoor, medical, or gastronomic niches prioritize performance over bargain shopping.
2. Mid-Tier “Everyday” Styles: Strong, Steady Margins
| Bag Style | COGS | Retail Price | Gross Margin | Attraction Factor |
|---|---|---|---|---|
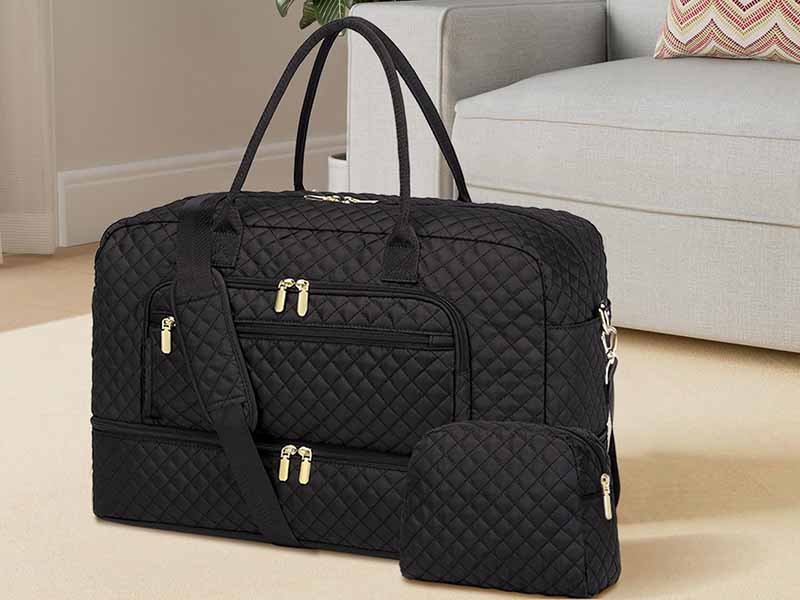
| Travel Backpacks | \$12–\$20 | \$40–\$70 | 50–71% | Versatility, organization features |
| Premium Leather Totes | \$25–\$40 | \$80–\$150 | 50–73% | Luxury feel, brand story, durability |
| Gym & Tool Bags | \$6–\$12 | \$20–\$40 | 57–70% | Utility design, compartmentalization |
Key Drivers:
- Design & Branding: Elevated stitching, logo embossing, and curated color palettes let brands charge a premium.
- Feature Bundling: Integrated laptop sleeves, padded straps, or detachable pouches increase perceived value.
- Repeat Purchases: Mid-range bags often appeal to loyal customers who return for updated models or matching accessories.
3. Entry-Level Basics: Volume Over Margin
| Bag Style | COGS | Retail Price | Gross Margin | Competitive Edge |
|---|---|---|---|---|
| Drawstring Bags | \$2–\$4 | \$8–\$15 | 50–73% | Ultra-low cost, impulse buys |
| Basic Canvas Totes | \$5–\$8 | \$12–\$20 | 40–60% | Eco-friendly messaging, bulk promos |
- Margin Reality: While percentage margins may look healthy, low unit values mean absolute profits per bag are small.
- Turnover Strategy: Success here depends on high volume, rapid replenishment, and minimal inventory risk.
4. Combining Styles for a Balanced Portfolio
A blended SKU strategy helps stabilize cash flow and profitability:
- Core Volume Drivers: Keep 2–3 basic styles (drawstring, canvas tote) to attract new customers and generate quick sales.
- Margin Boosters: Offer 3–4 high-value, specialty bags (dry bag, neoprene backpack) that deliver the bulk of profits.
- Seasonal/Promotional Lines: Rotate limited-edition premium leather or eco-materials styles to create buzz and justify higher markups.
5. Critical Considerations & Best Practices
- Customization Premium: Private-label embossing, color matching, or bespoke hardware can add \$5–\$20 to the wholesale price with minimal cost changes.
- Bundling & Upsells: Pair bags with matching accessories (pouches, straps) to increase average order values by 15–25%.
- Channel Mix Impact: Direct-to-consumer e-commerce often sustains a 20–30% higher margin than wholesale, but requires investment in marketing and fulfillment.
6. Szoneier’s Role in Margin Optimization
At Szoneier, we support brands by:
- Low-MOQ Prototyping: Test specialty bag concepts without large upfront commitments.
- Integrated Supply Chain: Secure competitive pricing on technical fabrics and hardware, improving material cost ratios by up to 10%.
- Design Consultation: Align style portfolios with market demand to maximize your highest-margin categories.
How Do Material Choices Impact Profitability?
Material selection directly shapes both cost structure and customer perception. Low-cost synthetics like polyester or nylon run \$3–\$8 per bag, yielding 60–65% gross margins at budget retail prices. Technical fabrics (neoprene, TPU) cost \$8–\$15 but support 65–70% margins on specialty bags. Premium leathers (\$20–\$50) underpin 55–60% margins at high-end price points. Sustainable options (recycled PET, plant-based leathers) command 10–20% price premiums, offsetting their slightly higher base costs with eco-driven demand.
Choosing your bag’s fabric is not just about feel and function—it’s a strategic decision that dictates your cost of goods sold (COGS), retail positioning, and ultimately, profit margins. Below, we explore major material categories, their cost profiles, margin potential, and how Szoneier leverages its supply chain to optimize both cost and quality.
1. Synthetic Workhorses: Polyester & Nylon
| Material | Fabric Cost per Bag | Typical Retail Price | Gross Margin (%) | Pros & Cons |
|---|---|---|---|---|
| Polyester (DWR-coated) | \$3–\$6 | \$15–\$25 | 60–76% | Affordable, customizable, light; needs reapplication of DWR over time |
| Nylon (Ripstop) | \$4–\$8 | \$20–\$35 | 57–77% | Durable, tear-resistant; higher base cost |
- Margin Insight: At a \$20 average retail price, a \$5 polyester bag delivers a 75% gross margin.
- Customer Appeal: These fabrics suit budget-conscious teams, promotional giveaways, and mass-market e-commerce.
2. Technical Fabrics: Neoprene, EVA, TPU Laminate
| Material | Fabric Cost per Bag | Typical Retail Price | Gross Margin (%) | Key Advantages |
|---|---|---|---|---|
| Neoprene | \$8–\$15 | \$35–\$60 | 57–75% | Insulating, protective, premium handfeel |
| TPU Laminate/Tarpaulin | \$6–\$12 | \$30–\$55 | 60–78% | Fully waterproof, easy wipe-clean |
| EVA Foam Panels | \$7–\$14 | \$30–\$50 | 58–86% | Structure retention, impact resistance |
- Value Proposition: Specialty swim or dry bags leverage these materials to justify premium pricing.
- Operational Note: TPU-coated fabrics can be heat-welded, reducing sewing costs but requiring specialized machinery.
3. Premium Naturals: Leather
| Leather Grade | Material Cost per Bag | Typical Retail Price | Gross Margin (%) | Strategic Benefits |
|---|---|---|---|---|
| Full-Grain Rawhide | \$25–\$50 | \$100–\$200 | 60–75% | Iconic luxury appeal, develops patina |
| Veg-Tan Leather | \$18–\$35 | \$80–\$150 | 56–77% | Excellent tooling & dye absorption |
- Market Position: Leather elevates a bag into a “forever piece,” supporting long-term brand equity.
- Volatility Risk: Hide prices can fluctuate ±10% due to global livestock and tannery conditions; purchase contracts mitigate exposure.
4. Sustainable & Specialty Materials
| Material | Cost Premium vs. Standard | Typical Retail Premium (%) | Gross Margin (%) | Sustainability Appeal |
|---|---|---|---|---|
| Recycled PET Fabrics | +\$1–\$3 | +10–15% | 65–80% | Closed-loop plastic reuse |
| Plant-Based Leather (PU/Bio) | +\$4–\$8 | +15–25% | 60–75% | Vegan, cruelty-free luxury |
- Consumer Trends: 65% of millennial and Gen Z buyers cite sustainability as a purchase influencer.
- Certification Needs: To avoid greenwashing, certify materials via Global Recycled Standard (GRS) or similar.
5. Hybrid Material Strategies
Combining materials lets you tier cost and features:
- Example: A backpack with a leather base (\$30), neoprene front pocket (\$10), and polyester lining (\$4) yields a \$44 material cost. Retailed at \$150, this hybrid design achieves a 70.7% gross margin while offering premium feel and technical performance.
6. Szoneier’s Supply-Chain Advantage
- Integrated Sourcing: Direct partnerships with tanneries and mills secure volume discounts up to 15%.
- Quality Consistency: In-house QA ensures each roll of fabric or hide batch meets tensile, abrasion, and colorfastness standards—reducing rejects by 8%.
- Low MOQ Testing: Clients can trial new materials in runs as small as 100 units, validating market response before scaling.
Do Custom and Private-Label Orders Outperform Branded Lines?
Custom OEM/ODM orders typically yield stable net margins of 10–20% with minimal marketing spend and predictable volume, while own-brand lines can achieve 20–30% net margins but require significant investment in design, customer acquisition, and inventory. By combining private-label production (low MOQ, quick turnaround) with selective own-brand launches, manufacturers enjoy both steady cash flow and higher-margin opportunities—balancing risk and reward across diverse revenue streams.
Deciding between manufacturing exclusively for other brands or launching your own label is a pivotal strategy choice. Each model presents distinct margin structures, operational demands, and growth trajectories. Let’s break down the economics, risks, and best-practice approaches for both OEM/ODM and branded production—and examine how a hybrid model can offer the best of both worlds.
1. Margin Structures and Cash Flow
| Model | Gross Margin | Net Margin | Upfront Investment | Marketing & Sales Cost |
|---|---|---|---|---|
| OEM/ODM | 15–25% | 10–20% | Low (samples only) | Minimal |
| Own-Brand (DTC) | 60–70% | 20–30% | High (\$20K–\$100K) | High (20–30% of sales) |
| Hybrid | 40–50% (average) | 15–25% | Medium | Medium |
- OEM/ODM: Factories charge a mark-up on cost-plus (material + labor), typically 15–25%. With no branding or marketing, net margins stabilize around 10–20%, and payment terms are often net-30, ensuring predictable cash flow.
- Own-Brand: Direct-to-consumer (DTC) brands can command higher retail markups, yielding 60–70% gross margins. After accounting for marketing, fulfillment, and customer support (20–30% of revenue), net margins usually reach 20–30%—but cash flow is less predictable due to inventory cycles and promotional discounts.
2. Operational Complexity and Risk
OEM/ODM Advantages:
- Low Risk, Low Investment: No branding or marketing costs; minimal inventory risk since clients typically handle distribution.
- Stable Demand: Long-term contracts with established brands guarantee volume and utilization of factory capacity.
OEM/ODM Challenges:
- Margin Ceiling: Factory profit is capped by client negotiations; limited upside from product innovation or premium positioning.
- Client Dependency: Losing a major client can severely impact revenue; diversification across multiple clients is key.
Own-Brand Advantages:
- Unlimited Upside: Building brand equity unlocks licensing deals, higher price increases, and even wholesale partnerships.
- Full Control: You dictate design, pricing strategy, and customer experience—enabling rapid pivoting to market trends.
Own-Brand Challenges:
- High Upfront Costs: Design, prototyping, website development, and initial inventory can total \$20,000–\$100,000 before a single sale.
- Marketing Investment: Effective customer acquisition via social media, SEO, and paid ads often consumes 20–30% of revenue.
- Inventory Risk: Overstocking or misjudging demand leads to markdowns, eroding margins.
3. The Hybrid Model: Best of Both Worlds
Many successful manufacturers blend OEM/ODM and own-brand offerings:
| Revenue Source | % of Total | Role |
|---|---|---|
| OEM/ODM Contracts | 50–70% | Baseline cash flow and factory utilization |
| Private-Label Projects | 10–20% | Higher margins, minimal marketing |
| Own-Brand DTC Launches | 20–30% | Brand building and equity creation |
- Cash Flow Stability: OEM orders ensure steady revenue, covering fixed costs and enabling investment in brand building.
- Margin Enhancement: Occasional private-label runs at slightly higher markups (25–35%) bridge the gap between factory and retail margins without the full cost of a branded launch.
- Brand Growth: Profits from OEM/ODM can fund e-commerce marketing experiments and small-scale DTC releases—validating concepts before scaling.
4. Key Success Factors
- Client Diversification: For OEM/ODM, secure multiple clients across industries (fashion, outdoor, corporate gifting) to reduce dependency risk.
- Low MOQ Prototyping: Use Szoneier’s rapid sample service (MOQ 100 units) to test private-label ideas and niche markets before committing large runs.
- Brand Positioning: If launching your own line, focus on a clear value proposition—e.g., sustainable materials, superior craftsmanship, or functional innovation.
- Lean Inventory Management: Employ just-in-time ordering for raw materials and small batch production for new SKUs to minimize dead stock.
- Data-Driven Marketing: Track customer acquisition costs (CAC) and lifetime value (LTV) meticulously. Aim for LTV/CAC ratios above 3:1 to ensure sustainable growth.
5. Case Study: Szoneier’s Clients
- Outdoor Gear Brand (OEM): Enjoyed a 20% net margin, with consistent quarterly orders of 5,000 dry bags, enabling predictable factory scheduling.
- Boutique Handbag Label (Own-Brand): Invested \$50,000 upfront, attained 65% gross margin on leather totes, and reached breakeven in 8 months through targeted influencer campaigns.
- Hybrid Model Example: A wellness company ordered 2,000 smell-proof bags as private-label (30% margin) and simultaneously tested a branded line of 300 units—refining designs based on early feedback before scaling.
How Can Manufacturers Optimize Pricing, Sales Channels, and Operations?
Manufacturers optimize profitability by adopting value-based pricing, diversifying sales channels (B2B, e-commerce, wholesale), and streamlining operations with lean production and automation. Implement tiered pricing—offering volume discounts—and upsell customization options. Leverage direct-to-consumer platforms for higher margins, while maintaining B2B relationships for stable volume. Invest in automated cutting, digital patterning, and real-time inventory management to reduce labor costs by 20% and material waste by 10%, boosting margins and responsiveness.
Refining your commercial approach and operational practices can elevate profitability beyond raw cost-cutting. Let’s explore advanced strategies.
1. Value-Based Pricing & Tiered Models
- Dynamic Markup: Instead of flat markups, apply 2–3 price tiers—basic, premium, and deluxe—based on material and feature sets. This captures consumer surplus and increases average order value (AOV).
- Customization Premiums: Charge \$10–\$30 extra for private-label embossing, unique colorways, or custom hardware. This adds 5–10% margin lift with minimal additional cost.
2. Sales Channel Diversification
- B2B Wholesale: Secure steady, bulk orders at lower unit prices but faster payment cycles (net-30).
- Direct-to-Consumer (DTC): Higher margins (60–70%), but requires investment in marketing (PPC, social ads) and fulfillment infrastructure.
- Marketplace Platforms: Amazon, Etsy, and regional marketplaces offer exposure but charge fees (10–20%)—still valuable for testing new products.
| Channel | Margin Range | Inventory Risk | Marketing Cost | Payment Terms |
|---|---|---|---|---|
| B2B Wholesale | 30–40% | Low | Low | Net-30 to Net-60 |
| DTC E-commerce | 60–70% | Medium | High (20% sales) | Prepayment or COD |
| Marketplaces | 40–50% | Medium | Medium (Platform) | Immediate or Net-15 |
3. Lean Production & Automation
- Digital Patterning & CNC Cutting: Reduces material waste by up to 10% and labor by 15%.
- Automated Workflow Software: Real-time tracking of orders, inventory, and production schedules improves on-time delivery by 20%.
- Kaizen & 5S Methodologies: Continuous improvement practices eliminate non-value tasks on the factory floor.
4. Inventory & Supply Chain Management
- Just-in-Time (JIT) Orders: Minimize inventory holding costs but require reliable suppliers.
- Safety Stock for Key Components: Maintain buffer for fast-moving SKUs to avoid stockouts—especially for standard tote fabrics.
- Vendor-Managed Inventory (VMI): Let suppliers handle raw material replenishment based on consumption data.
5. Marketing & Brand Building
- Content & SEO: Invest in long-form blog posts (like this one) to drive organic traffic and reduce reliance on paid ads.
- Influencer Partnerships: Micro-influencers can generate high-quality leads at lower cost-per-acquisition.
- Email Automation: Abandoned cart flows and post-purchase sequences boost repeat purchases by 15–20%.
Conclusion & Custom Inquiry
Making bags can be a profitable endeavor—if you master cost drivers, select high-margin styles, choose optimal materials, leverage OEM/ODM opportunities, and refine your operations. Whether you’re launching a private-label brand or scaling production for other companies, Szoneier’s 18 years of R\&D and manufacturing expertise can help you navigate these complexities.
Contact Szoneier today for a free consultation on custom bag development. From sample builds to low-MOQ production and global logistics, we’ll partner with you to create high-quality, profitable bag lines tailored to your market.
manufacturer Categories
- Custom Tote Bags Manufacturer
- custom backpacks Manufacturer
- custom travel bags& Duffle bags manufacturer
- custom makeup bags & toiletry bags manufacturer
- custom cooler bags manufacturer
- custom drawstring bags manufacturer
- custom makeup bags & toiletry bags manufacturer
- custom golf bags manufacturer
- custom fireproof bags manufacturer
- custom dry bags manufacturer
- custom ski bags manufacturer
- custom gym & sports bags manufacturer
- custom laptop bags manufacturer
- custom tactical bags manufacturer
- custom beach bags manufacturer
- custom medical bags manufacturer
- custom camera bags manufacturer
- custom wetsuits manufacturer
- custom leather goods manufacturer
- more personalized products
Can't find the answers?
No worries, please contact us and we will answer all the questions you have during the whole process of bag customization.
Make A Sample First?
If you have your own artwork, logo design files, or just an idea,please provide details about your project requirements, including preferred fabric, color, and customization options,we’re excited to assist you in bringing your bespoke bag designs to life through our sample production process.